An analyst agent over Australian data.
Zenancy is an analyst agent over a library of open and licensed Australian data sources. Ask a question in plain English. The report names every source it used and shows the method.
01Property & development
Sydney depot site shortlist
Screened every industrial parcel in New South Wales against eight constraints, then ranked the eligible lots by the population within a 30-minute drive.
Shortlist sites for a last-mile depot: E4 or E3 lots of 3,000–10,000 m² within 30 minutes' truck drive of Sydney Airport, less than 5 minutes from a motorway ramp, with at least 2 million residents inside a 30-minute drive, no residential zoning within 200 m, outside flood planning areas and not on the EPA contaminated-land record. Rank by catchment population, show the last sale on each lot, and map the top 20.
| Rank | Suburb | Lot area (m²) | Residents within 30-minute car drive |
|---|---|---|---|
| 1 | Auburn (NSW) | 6,452 | 2,834,287 |
| 2 | Padstow | 3,484 | 2,741,691 |
| 3 | Homebush West | 4,805 | 2,734,450 |
| 4 | Moorebank | 3,221 | 2,722,333 |
| 5 | Padstow | 4,910 | 2,686,461 |
5 of 20 rows. The full table is on the run’s page.
02Climate & hazard risk
Port Macquarie climate risk ranking
Joined every residential address in one council area to the bushfire, flood-extent and coastal-hazard maps, then ranked the suburbs by exposure.
Profile physical climate risk across Port Macquarie-Hastings: for every residential address, whether it sits on bushfire-prone land, inside a mapped flood extent or in a coastal hazard layer. Rank suburbs by the number of exposed addresses, table the top ten with each hazard's share, chart the split, and map the share of exposed addresses by suburb.
Residential addresses exposed to at least one mapped hazard
16,356addresses
of 38,928 residential addresses in Port Macquarie-Hastings (42.0%)
03Agriculture & regional land
Riverina irrigation LGAs comparison
Compared five irrigation councils on climate normals, projected heat, soil and mapped land use, then broke the irrigated share down to statistical areas.
Compare the Riverina irrigation LGAs — Griffith, Leeton, Narrandera, Murrumbidgee and Murray River — on their 30-year rainfall normal, mean maximum temperature, days over 35 °C today and projected for 2050, topsoil carbon and clay, and the split of irrigated cropping, dryland cropping and grazing. Table by LGA, chart the projected change in hot days, and map the share of irrigated land by SA2.
| LGA | Irrigated cropping share of mapped agricultural land (%) | Change in hot days, 2050 SSP5 8.5 (days/year) |
|---|---|---|
| Griffith | 62.5 | 31.6 |
| Leeton | 58.4 | 31.9 |
| Murray River | 23.5 | 23.4 |
| Murrumbidgee | 34.6 | 28.2 |
| Narrandera | 4.5 | 33.3 |
04Energy transition
Central-West Orana solar farm screening
Screened a declared renewable energy zone for rural lots that meet area, slope and transmission-distance thresholds for a solar farm, and mapped the results against the transmission lines.
Screen the Central-West Orana REZ for solar-farm land: rural-zoned lots of 100 ha or more, slope under 5 degrees at the lot, within 5 km of a 330 kV or higher transmission line. Flag bushfire-prone land rather than excluding it, count the addresses within 1 km as a neighbour proxy, rank by area and map the top 20 with the transmission lines.
| Suburb | Lot area (ha) | Slope (degrees) | Nearest ≥330 kV line (km) |
|---|---|---|---|
| Cope | 749.9 | 0.4 | 2.84 |
| Spicers Creek | 562.3 | 2.83 | 1.58 |
| Wuuluman | 554.4 | 2.38 | 1.14 |
| Bodangora | 526.6 | 3.1 | 3.52 |
| Euchareena | 515 | 2.16 | 3.04 |
5 of 20 rows. The full table is on the run’s page.
05Energy transition
NSW data-centre land screening
Screened NSW for large rural or industrial lots near high-capacity transmission and a sealed arterial, with few neighbours but a town in reach, and read the thirty-year solar resource at each so the site could carry a solar farm as well.
Screen NSW for data-centre land: rural- or industrial-zoned lots of 20 ha or more, within 5 km of a 330 kV or higher transmission line and 15 km of a transmission substation, within 3 km of a sealed arterial or highway, with fewer than 200 residents within 2 km but within 30 km of a town of 5,000 to 50,000 people. Exclude flood planning land and slope over 5 degrees, flag bushfire-prone land, and add the 30-year mean daily solar exposure so the same site could carry a co-located solar farm. Rank by area and map the top 25 with the transmission lines and substations.
| Screen stage | Lots remaining | Median area of final lots (ha) | Minimum solar exposure (kWh/m²/day) |
|---|---|---|---|
| NSW parcels in source | 3,354,329 | — | — |
| Rural or industrial, >=20 ha, non-strata | 282,366 | — | — |
| Also within 5 km of 330 kV+ line | 27,686 | — | — |
| Also within 15 km of transmission substation | 18,424 | — | — |
| Also within 3 km of sealed arterial/highway | 9,225 | — | — |
5 of 8 rows. The full table is on the run’s page.
06Politics & elections
NSW marginal Labor seats
Listed the seats one party won narrowly at a federal election, with the margin, the swing, the boundary change and the demography of each electorate.
Which NSW federal seats did Labor win in 2025 by under 6% on two-party-preferred? For each, show the margin, the swing since 2022, how much the boundary changed, median household income, median age and the share of land bushfire-prone. Chart the swing against the margin, and map the tightest seat's booths coloured by Labor two-party share.
| Seat | Margin (percentage points) | Swing to labor since 2022 (percentage points) | Boundary change since 2022 (%) |
|---|---|---|---|
| Banks | 2.39 | 5.03 | 23.6 |
| Hughes | 3.06 | 6.52 | 5.9 |
| Gilmore | 5.13 | 4.96 | -0.3 |
07Government & public affairs
NSW federal electorate climate and income
Combined projected heat, bushfire-prone land and household income across every federal electorate in one state, then identified the seats with the largest rise in hot days and the lowest incomes.
For every NSW federal electorate, combine projected days over 35 °C by 2050 under the high-emissions scenario, the share of land that is bushfire-prone, and the average median household income. Which ten seats pair the largest rise in hot days with the lowest incomes? Table them with the sitting member, chart heat rise against income, and map all NSW seats by projected hot days.
| Federal electorate | Sitting member | Party | Rise in days over 35 °C by 2050 |
|---|---|---|---|
| Farrer | Sussan LEY | Liberal | 30.48 |
| Parkes | Jamie CHAFFEY | The Nationals | 59.18 |
| New England | Barnaby JOYCE | The Nationals | 24.18 |
| Riverina | Michael McCORMACK | The Nationals | 24.87 |
| Calare | Andrew GEE | Independent | 24.09 |
5 of 10 rows. The full table is on the run’s page.
The library
The data library
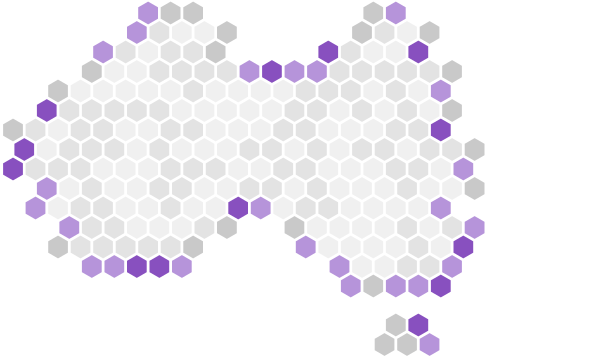
Open government data from dozens of portals, cleaned and joined so it can be queried together, alongside licensed commercial datasets. New datasets are added each month.
01
Ask in plain English
Describe what you need to know. No portal, shapefile or spreadsheet work is required.
02
The agent runs the analysis
It selects sources from the library, runs the analysis in a sandbox, and checks its own results.
03
The report shows its working
Tables, charts and maps. Every number is tied to a named source. Gaps in coverage are declared.
Request access to the private preview
Zenancy is in private preview with design partners.
Request access